
 Co-authored by CAIDA’s Roderick Fanou, Postdoctoral Scholar; Ricky Mok, Assistant Research Scientist; Bradley Huffaker, Technical Manager; and Kc Claffy, Founder and Director.
The underlying physical infrastructure of the Internet includes a mesh of submarine cables, generally shared by network operators who purchase capacity from the cable owners.
As of late 2020, over 400 submarine cables interconnected continents worldwide and constituted the oceanic backbone of the Internet. Although they carry more than 99% of international traffic, little academic research has occurred to isolate end-to-end performance changes induced by their launch.
It is generally assumed that the deployment of undersea cables improves performance, at least for economies around the cable. But by how much, and what happens to traffic from and towards neighbouring economies?
To study this, we looked at the South Atlantic Cable System (SACS), which was launched in mid-September, 2018. It was the first transatlantic cable traversing the southern hemisphere and provided an ideal opportunity to examine what happened to traffic between different Internet regions pre and post-launch.
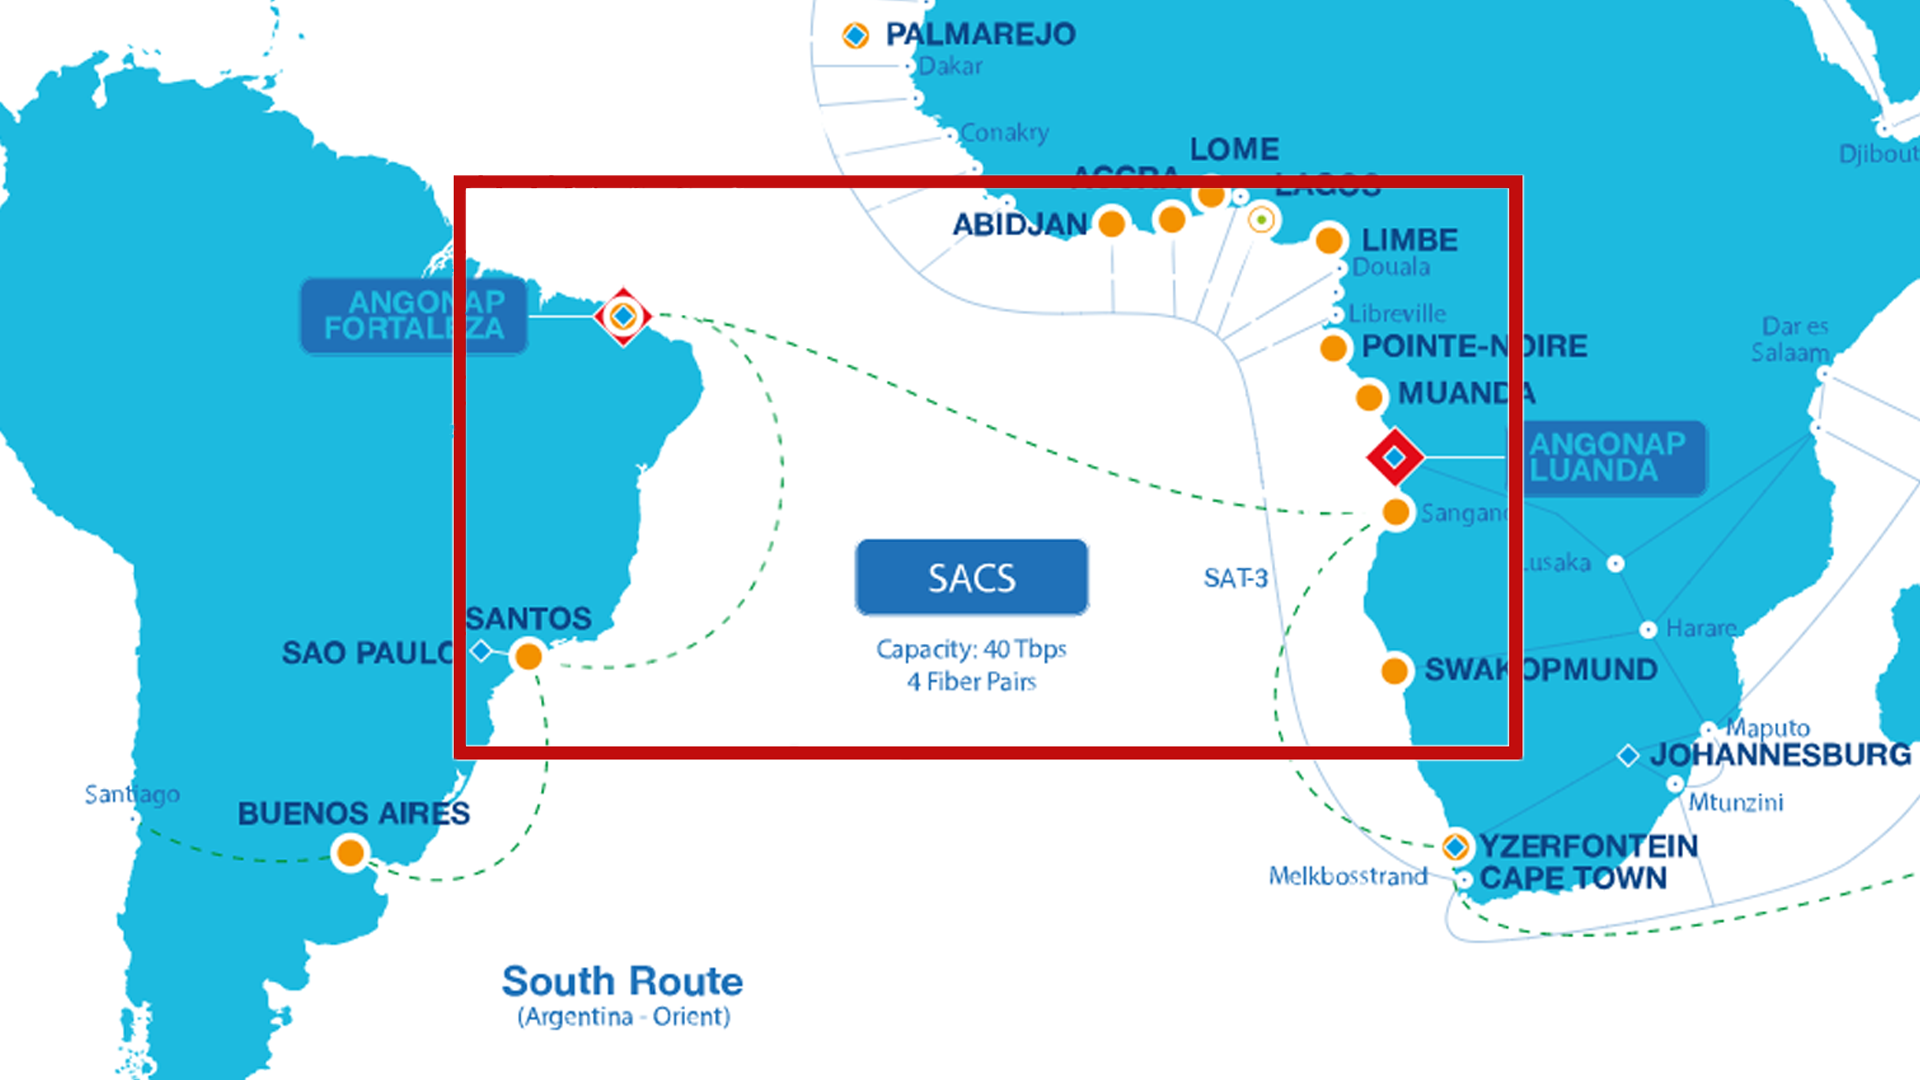 Figure 1 – This image shows the Angola Cables Network, which includes the SACS cable. The cable stretches for 6,165km and has a capacity of 40Tbps and 4 fibre pairs (Source: Angola Cables)SACS connects Angola in Africa to Brazil in South America. In our paper, ‘Unintended consequences: Effects of submarine cable deployment on Internet routing‘, we shed empirical light on how it affected traffic patterns, by investigating the operational impact of SACS on Internet routing. Last year, we presented our results at the Passive and Active Measurement Conference (PAM) 2020, where it was awarded ‘best paper’.
Here, we summarize the contributions of our study, including our methodology, and some findings.
How did we measure the change in performance?
Our methodology quantifies the end-to-end communication performance changes from a new submarine cable deployment on Internet paths.
Our approach relies on existing subsea maps/databases and public measurement infrastructures.
Our method has four steps:
- Collect candidate IP paths that could have crossed the cable
- Identify router IP interfaces on both sides of the cable based on those candidate IP paths
- Search for corresponding paths (between same endpoint pairs) in historical traceroute datasets
- Annotate collected paths with the necessary information for analysis such as hostnames, ASes, IP geolocations, and round-trip time (RTTs) differences between consecutive hops
Collecting candidate IP paths
Identifying which Internet paths are passing through a newly deployed cable is quite challenging. To accurately identify IPs on both sides of the cable, we need samples of IP paths crossing it in both directions, which we can obtain by running measurements after the cable launch.
Our first step involves executing, in both directions, traceroutes between vantage points (VPs) located within two networks, denoted AS1 and AS2, that are topologically close to the respective ends of the cable.
From this, we get candidate IP paths containing IP addresses of routers traversed by packets from AS1 to AS2 or vice-versa via the cable as well as the round-trip times (RTTs) from the respective source IP addresses to each of them. We selected the networks hosting vantage points (VPs) as well as the active VPs within those networks, using existing measurement platforms (CAIDA Ark and RIPE Atlas) and publicly available sea cable databases/maps.
Identifying router interfaces at both ends of the cable
Using the speed of light constraint and the known length of the cable, we were able to deduce the minimum RTT to cross the cable. This gave us a threshold that we could use to narrow down the candidate IP paths, finding matching traceroutes containing RTT bumps greater or equal to the inferred minimum threshold.
We looked for cases where the locations of those IP interfaces, according to geolocation databases Netacuity and Maxmind, match the countries linked by the new subsea cable. Then, we inferred matching pairs of potential IPs on each side of the cable and looked for router aliases of those IPs.
Searching for corresponding paths in historical traceroute datasets
Using existing measurement platforms RIPE Atlas and CAIDA Ark, we looked for historical traceroutes containing any of the identified pairs separated by an RTT bump, greater or equal to the minimum threshold needed to cross the studied cable. We then grouped them into two sets, depending on whether they were run pre or post-cable launch.
Annotating collected paths with the necessary information for analysis
We annotated these IP paths with hostnames, ASes, locations, and RTT differences between consecutive hops.
Finally, we used three metrics to evaluate end-to-end performance and AS paths, before and after the cable launch:
- The RTTs to the common IP hops closest to the traceroute destinations determines the time that packets took to travel from a source interface to a common IP close to a given destination network, measured before and after the cable launch
- The AS-centrality of transit ASes represents the percentage of paths for which an AS played a role in transit
- The length of AS paths crossing the studied cable operator’s network post-event, which we compared to the length of the AS paths serving the corresponding source IP destination prefixes, pre-event
So what did we discover?
Comparing RTTs before and after SACS
We started our analysis by comparing RTTs before and after SACS deployment. For the same source VP and destination prefix, we built a set of common IP hops in the traces before and after SACS, and selected the IP closest to the destination as a point of comparison.
Using the RTTs from VPs toward IP hops from the traces pre and post-SACS, we plotted the box plots of Figure 2, clustering RTTs by continent and measurement platform.
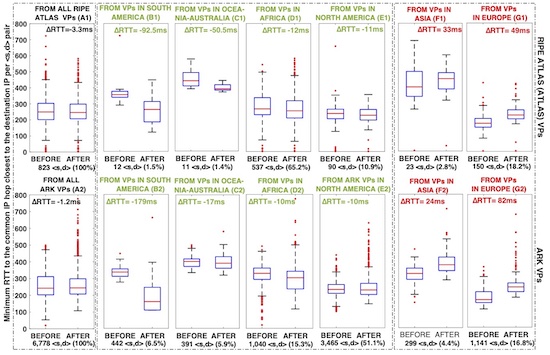 Figure 2 – Box plots of minimum RTTs from Ark and Atlas VPs to the common IP hops closest to the destination IPs. The red line of every box plot represents the median of these minimum RTTs; we marked the 75th and 25th percentile as well as the interquartile range (IQR).
What was the impact of SACS on latency?
Although the median latency across the whole dataset for paths crossing SACS post-launch did not change much (median RTT drops of 2-3ms); this hides significant decreases and increases in latency across paths from/to specific regions.
Interestingly, paths from South America experienced a median latency decrease of 38%, which was quite significant compared to paths from Oceania-Australia (8% decrease), and those from Africa (3%).
At the economic level, we found predictable performance improvements (RTT decrease) for paths going from Africa to Brazil, or from South America to Angola. However, we found an asymmetrical RTT reduction; the decrease of the median RTT from Africa to Brazil (73ms) was a third of that from South America to Angola (226ms). We also noted some unpredicted and unreported performance degradations. For example, we saw packets sub-optimally routed through SACS for paths going from North America to Brazil or Africa/Europe to Angola, leading to latency increases.
Comparing Transit Structure
We provide an in-depth inspection of the transit structure pre and post-SACS, an analysis of the impact on AS path lengths, and a validation of our results in the paper.
What are the contributions and key findings of this study?
In summary, the key contributions of this study can be listed as follows:
- We introduced a reproducible method to investigate the impact of a cable deployment on macroscopic Internet topology and performance
- We applied our methodology to the case of SACS, the first trans-Atlantic cable from South America to Africa
- We discovered that the RTT decrease for IP paths going from Africa to Brazil was roughly a third of that noticed on paths from South America to Angola
- Further, we discovered surprising performance degradations to/from some regions and analyzed the root-causes of these unintended consequences
From the findings of this paper, we suggest that to avoid suboptimal routing post-activation of cables in the future, ASes could inform BGP neighbours to allow time for changes, ensure optimal iBGP configurations post-activation, and use measurement platforms to verify path optimality.
Our code and data are published to facilitate reproducibility. This codebase can be extended to other cable use-cases.
This blog post has been republished from https://blog.apnic.net/2021/02/22/unintended-consequences-of-submarine-cable-deployment-on-internet-routing published in February 22, 2021.
About the author

After obtaining his PhD in Telematics Engineering from IMDEA Networks Institute and Universidad Carlos III de Madrid, Spain in 2017, Roderick Fanou, joined CAIDA (University of California, San Diego), US in March 2018, where he worked as a Postdoctoral Scholar till March 2021. During his stay, he contributed to the MANIC and PANDA projects alongside Amogh Dhamdhere (in 2018) and Kc Claffy. His research activities involved assisting with the design and development of new applications as well as the integration of existing codebases that measure interdomain congestion, topology, and performance, for enabling large-scale scientific projects.
The study presented by this post is one of the outcomes of his collaboration with the CAIDA team.
